Before we started tracking, we could only see ads that were still running when we found them, so the older months lean towards ads that lasted. We only see ads that run on Facebook, Instagram and Google, not the whole market.
What’s rising
Share of new plumbing ads, a month ago against now.
- Phone-filmed ads 1% → 6%
- Ads with a percentage off 5% → 9%
New ads each month by format, Nov to Oct.
Nov Dec Jan Feb Mar Apr May Jun Jul Aug Sep Oct
When plumbing ads go up
New ads by calendar month, over the last 12 months.
- J January: 17 new ads
- F February: 56 new ads
- M March: 78 new ads
- A April: 63 new ads
- M May: 151 new ads
- J June: 142 new ads
- J July: 176 new ads
- A August: 323 new ads
- S September: 418 new ads
- O October: 940 new ads
- N November: 6 new ads
- D December: 13 new ads
Most new plumbing ads went up from August to October (71%).
What keeps running
Average staying power, out of 100: how much longer these ads kept running than other plumbing ads. It isn’t spend or results.
By style
- Photo or graphic 55
- Animation 53
- Job being done 52
- Testimonial 50
- Talking to camera 48
- Phone-filmed 46
- Before and after 41
By opening
- Curiosity 59
- Bold claim 55
- Problem 54
- Reviews 51
- Number 43
- Question 42
By offer
- Bundle 61
- Free extra 60
- Percentage off 57
- Money off 57
- Financing 53
- Free quote 47
Curiosity ads: staying power 59 vs 42 for question ads.






















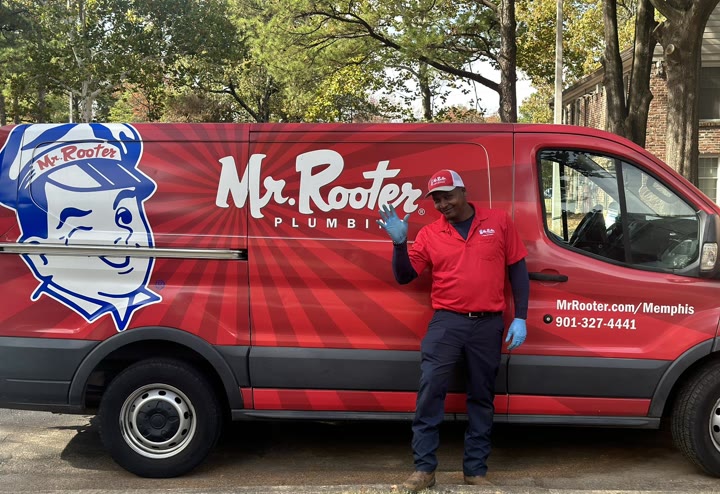



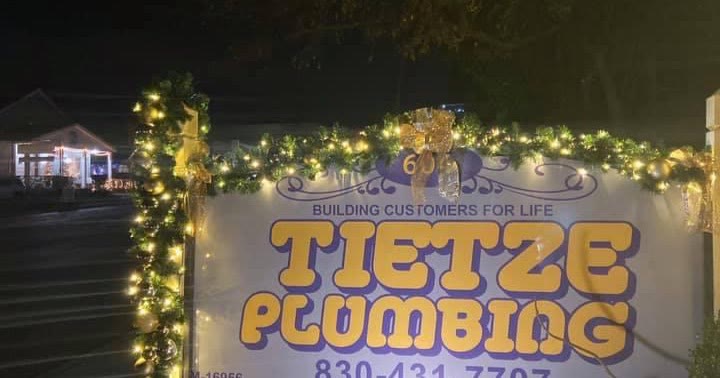
 Valley Home Services2183 days
 0:15 Primewest Plumbing1230 days
 King Heating, Cooling & Plumbing505 days
 Priya can make one with your price